How much traffic does the top keyword position garner on Google?
Have you ever wondered how much traffic the top keyword position on Google can bring a site, for a hotly-contested term? Or, how much traffic does the top slot get you, compared with the second slot?
Most of the major SEOs and top companies keep such figures as closely-guarded secrets. Even the search engines keep the numbers of searches by various keywords secret, using various techniques to hide actual values.
The much-touted Eye Tracking Study conducted by Enquiro and Did-It show that the first listings on Google SERPs are looked at and clicked upon the most by users. Most pros already concluded this through common sense, but it’s difficult to get actual traffic amounts associated with the rankings of listings on SERPs.
I’m going to change this situation right here, right now, thanks to new data that Google has graciously begun providing to the public, and thanks to a brief reshuffling of rankings on a top keyword for one of the sites that I manage. Read on, and I’ll elaborate.
Recently, Google had a sudden and inexplicable reshuffling of keyword rankings for one of the most hotly-contested keyword terms on the internet, and this seemingly-arbitrary reshuffling affected one of the sites that I manage. Now, due to my work I have to play the boring old “proprietary information” card just like everyone else, so I cannot reveal the site nor the precise keyword that was affected. Suffice it to say, though, that some companies have paid literally millions of dollars in an attempt to gain first ranking for this key term, and suffice it to say that my longterm work has helped to keep our site in the first position for this term since at least the year 2000. (We optimize on millions of keyword combinations, and come up first on a great many of those, so I’m not revealing any proprietary information here.)
Even though I can’t reveal all those “proprietary” specifics, I can give enough specific info to make this very interesting, and I can reveal traffic specifics about some top keywords that have been hitherto Secrets held by various companies.
For a couple of days, our rank on the hotly-contested term suddenly dropped to second slot across most Google data centers. Nothing major was changed on our site/environment nor on the site that popped up to the first slot, and our analysis showed no clear reason for the sudden shift. We thought it could be that Google tweaked some thresholds on the various factors they use in rankings. The change was inexplicable, because it seemed very unlikely that the competitor site could be considered more relevant for the keyword, compared with our site, for a variety of reasons.
After a couple of unhappy days of obsessive checking for SEO mistakes or other environmental issues, the rankings started reverting back to their former order, and it seemed clear that there was some sort of odd and temporary mistake which took some days of processing in Google before the rankings for these sites and this keyword returned to their previous equilibrium.
Now the downside of seemingly-arbitrary reshufflings is that you may lose some traffic. The cool side of it is that it provided very interesting metrics to compare with the historical data.
For the sake of convenience, let’s refer to the keyword in question as Term X.
I can tell you that our site receives approximately 30k of visits on average per day from Google, just from keyword searches for Term X. There’s typically one or two Sponsored Links just above us on the SERP, and a few Sponsored Links on the right side column, too.
When we dropped to second slot on the SERP for Term X, we lost approx 18k of visits per day. So, there it is: the difference between the number one slot and the number two slot for a major keyword term comes to about a 60 % change in visits!
Now, to make this even more interesting, we can now relate this data about a keyword that we do know Google referral traffic for, with some keywords for which we don’t have direct data. This can be done by comparing search traffic for terms using the recently-launched Google Trends interface.
By submitting a few keyword terms to Google trends, separated by commas, Google will return back a graph which shows the amount of searches over time for each of the keywords. If you know how much traffic is produced by one keyword term, and then find some other keyword terms which have histograms which are near to it on Google Trends, you can deduce that their search traffic in Google is very similar, and you can further deduce that their clickthrough values for sites which share the same keyword rank slots on the SERPs will be closely similar to your known value as well.
For example, I found that the keywords “restaurants”, “nyc”, “miami”, “seattle”, and “television” all have histograms that are very close to my Term X during 2006:
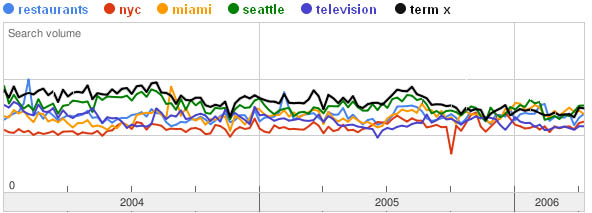
Because I know how much traffic I receive from Google on Term X, I now have a very, very good idea of how much referral traffic may be associated with the top slots for Restaurants, NYC, Miami, Seattle, and Television! Occupying the top position for each of those keywords likely would bring a site about 30k in visits!
It’d be nice if Google would actually spell out the units for the vertical dimension on their Trends graphs, to make this utility even more useful. But, we can achieve the next best thing through deduction and interpolation.
Now, how do you estimate the referral traffic for a keyword which has a significantly different vertical value on the Google Trends graphs, from your known keyword value? We can’t immediately assume that the pale gray bands on the vertical dimension are consistent units, since Google likes to obfuscate actual values. (For example, Google doesn’t display actual search values for their Zeitgeist comparison of popular search terms, nor do they show actual numbers of searches in their advertising estimation tools. And, they also don’t tell actual PageRank values for sites.) Just as with the PageRank indicator in the Google Toolbar, it’s possible that their Trends graphs are made on a logarithmic scale. They aim to just show us vague, quantitative values for the volume of searches by keywords.
I don’t know why they insist on obfuscation when it becomes easily possible for us to estimate some true values with the data provided, as I’ve demonstrated. (This reminds me of how the US Government used to block one of the three values provided by the GPS satellites in order to make it harder for terrorists to target missiles. Yet, a few researchers demonstrated that it was no hard work to triangulate the coordinate data from a few different satellites in order to estimate the blocked values with fairly good accuracy.)
All we need to do now is to compare referral data from a few different keywords with significantly different vertical trend lines. That would give us enough data to estimate the vertical units of the graph scales. (I know I’m assuming a lot here — after all, they dynamically change the vertical scales according to the quantity of searches for different queries submitted to Google Trends. And, I’m assuming that referral traffic would be similar for the top keyword position for various different terms. But, once you know the vertical scale for a particular term, you can easily figure out how to resize the scale when comparing with other keywords, and it’s not unreasonable to figure that referral traffic for the top position sites may be fairly consistent, regardless of the keywords, based on the results from the Eye Tracking Study.)
I know a few nomographic tricks from back when I was a scientific illustrator, and compared with some conversion work I did for AASHTO engineering guides used by highway engineers, this should be a walk in a park!
We may still not know the raw number of searches on Google for particular keywords, but we will be able to accurately estimate how much referral traffic can go to a site if they occupy the top one or two positions on the SERP. And that’s what we mainly want to have, isn’t it? A good way of estimating traffic for different keywords and ranking positions, right?
Stay tuned, because I’ll likely have sufficient data to match up a vertical scale for those trend graphs after I have a chance to properly analyze them.
Possible Related Posts
Posted by Chris of Silvery on 05/31/2006
Permalink | |  Print
| Trackback | Comments Off on How much traffic does the top keyword position garner on Google? | Comments RSS
Print
| Trackback | Comments Off on How much traffic does the top keyword position garner on Google? | Comments RSS
Filed under: Google, Keyword Research, Market Data, Tools, Tracking and Reporting Google, Google-Trends, Keyword-Analysis, Keyword-Positions, Keyword-Rankings, Top-Position


No comments for How much traffic does the top keyword position garner on Google?
No comments yet.
Sorry, the comment form is closed at this time.